Writing a Managed Internet Explorer Extension: Part 4 – Debugging
Picking up where we left of with Writing a Managed Internet Explorer Extension, debugging is where I wanted to go next. I promise I’ll get to more “feature” level stuff, but when stuff goes wrong, and it will, you need to know how to use your toolset. .NET Developers typically write some code and press F5 to see it work. When an exception, the debugger, already attached, steps up to the plate and tells you everything that is wrong. When you write an Internet Explorer Extension it isn’t as simple as that. You need to attach the debugger to an existing process, and even then it won’t treat you like you’re use to. Notably, breakpoints aren’t going to launch the debugger until the debugger is already attached. So we have a few options, and some tricks up our sleeves, to get the debugger to aide us.
Explicit Breakpoints
The simplest way to emulate a breakpoint is to put the following code in there:
System.Diagnostics.Debugger.Break()
Think of that as a breakpoint that is baked into your code. One thing to note
if you’ve never used it before is that the Break method has a
[Conditional(“DEBUG”)] attribute on it – so it’ll only work if you are
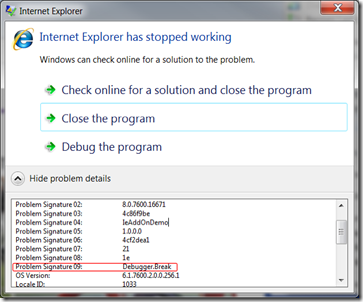
compiling in Debug. When this code gets hit, a fault will occur. It will ask you
if you want to close, or attach a debugger. Now is your opportunity to say “I
want a debugger!” and attach.
It’ll look like just a normal Internet Explorer crash, but if you probe at the details, “Problem Signature 09” will tell you if it’s a break. When working on a BHO, check this every time IE “crashes” – it’s very easy to forget that these are in there. It’s also important that you compile in Release mode when releasing to ensure none of these sneak out into the wild. The user isn’t going to look at the details and say, “Oh it’s just a breakpoint. I’ll attach and hit ‘continue’ and everything will be OK”. Once that’s done, choose Visual Studio as your debugger of choice (more on that later) and you should feel close to home.
This is by far one of the easiest ways to attach a debugger, the problem with it
is it requires a code change to get working, meaning you need to change the
code, close all instances of IE, drop in the new DLL, restart Internet Explorer,
and get it back into the state it was. A suggestion would be to attach on
SetSite when the site isn’t null. (That’s when the BHO is starting up.
Refresher here.) That way, your debugger is always attached throughout the
lifetime of the BHO. The disadvantage of that is it’s get intrusive if you like
IE as just a browser. You can always Disable the extension or run IE in Safe
Mode when you want to use it as an actual browser. If you take this approach,
I recommend using Debugger.Launch(). I’ll leave you to the MSDN Documents to
understand the details, but Launch won’t fault the application, it will skip
straight to the “Which debugger do you want to use?” dialog.
Attaching to an Existing Process
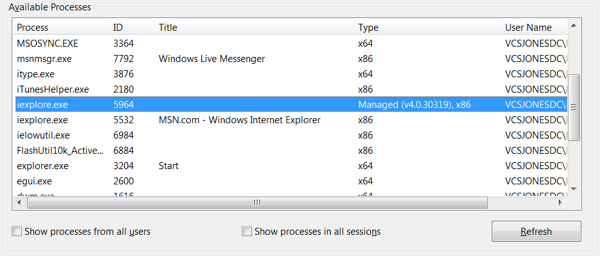
You can just as well attach to an existing process like you normally would, but there is one drawback: “Which process do I want to attach to?” In IE 8 that is a question that can be difficult to answer. Each tab has it’s own process (a trend in new generation browsers – IE was the first to support it). You will have at minimum of two IE processes. One for each tab, and one per actual instance of IE acting as a conductor for the other processes. Already, with just a single tab open, you have a 50/50 chance of getting it right if you guess. Visual Studio can give us some help though. If you pull up the Attach to Process Dialog, you should see your two instances of IE. The “Type” column should give it away. We want the one with Managed code in it (after all, the title of this blog series is “Writing a Managed Extension”).
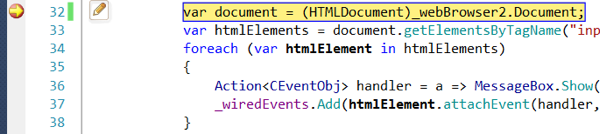
Once you’re attached, you can set regular breakpoints the normal way and they’ll get hit.
It isn’t quite as easy when you have multiple tabs open – sometimes that’s required when debugging a tricky issue. You have a few options here:
- When building a UI for your BHO (It’s a catch 22 – I know I haven’t gotten there yet) have it display the PID of the current process. That’s easy enough to do using the Process class. You can dumb it down a little more though and write a log file in a safe location (IE is picky where BHOs write to the File System Refresher here).
- Attach to all tab processes. That can lead to a lot of confusion of which tab you are currently in, because if you have two tabs open – and a breakpoint gets hit – which tab did it? The Threads Window should help you there if that is the route you choose.
- Always debug with a single tab, if you can.
More of this series
- Writing a Managed Internet Explorer Extension: Part 1 – Basics
- Writing a Managed Internet Explorer Extension: Part 2 – DOM Basics
- Writing a Managed Internet Explorer Extension: Part 3
- Writing a Managed Internet Explorer Extension: Part 4 – Debugging
- Writing a Managed Internet Explorer Extension: Part 5 – Working with the DOM
- Writing a Managed Internet Explorer Extension: Part 6 – Regrets